These Bitcoin charts show how BTC price could hit $100K before October

⚡ CryptoTradeSignals AI Take▲ Bullish
Tailwind for BTC. Momentum and demand are skewing to the upside.
Affected: BTCmedium confidence
Live signal on BTC in this story
Our own real-time Trap Score and AI verdict for the coin this story moves — original analysis, not from Cointelegraph.
KEY POINTS
- Bitcoin’s double-bottom setup, weekly RSI divergence and whale flows put traders on alert as BTC tests a key breakout zone.
Bitcoin’s double-bottom setup, weekly RSI divergence and whale flows put traders on alert as BTC tests a key breakout zone.
Read the full story at Cointelegraph →Summary & AI Take by CryptoTradeSignals — automated analysis, not financial advice. Full reporting belongs to Cointelegraph.
More Crypto news

Bitcoin’s Iran rally faces Japan rate test as it weighs 31-year highCryptoSlate
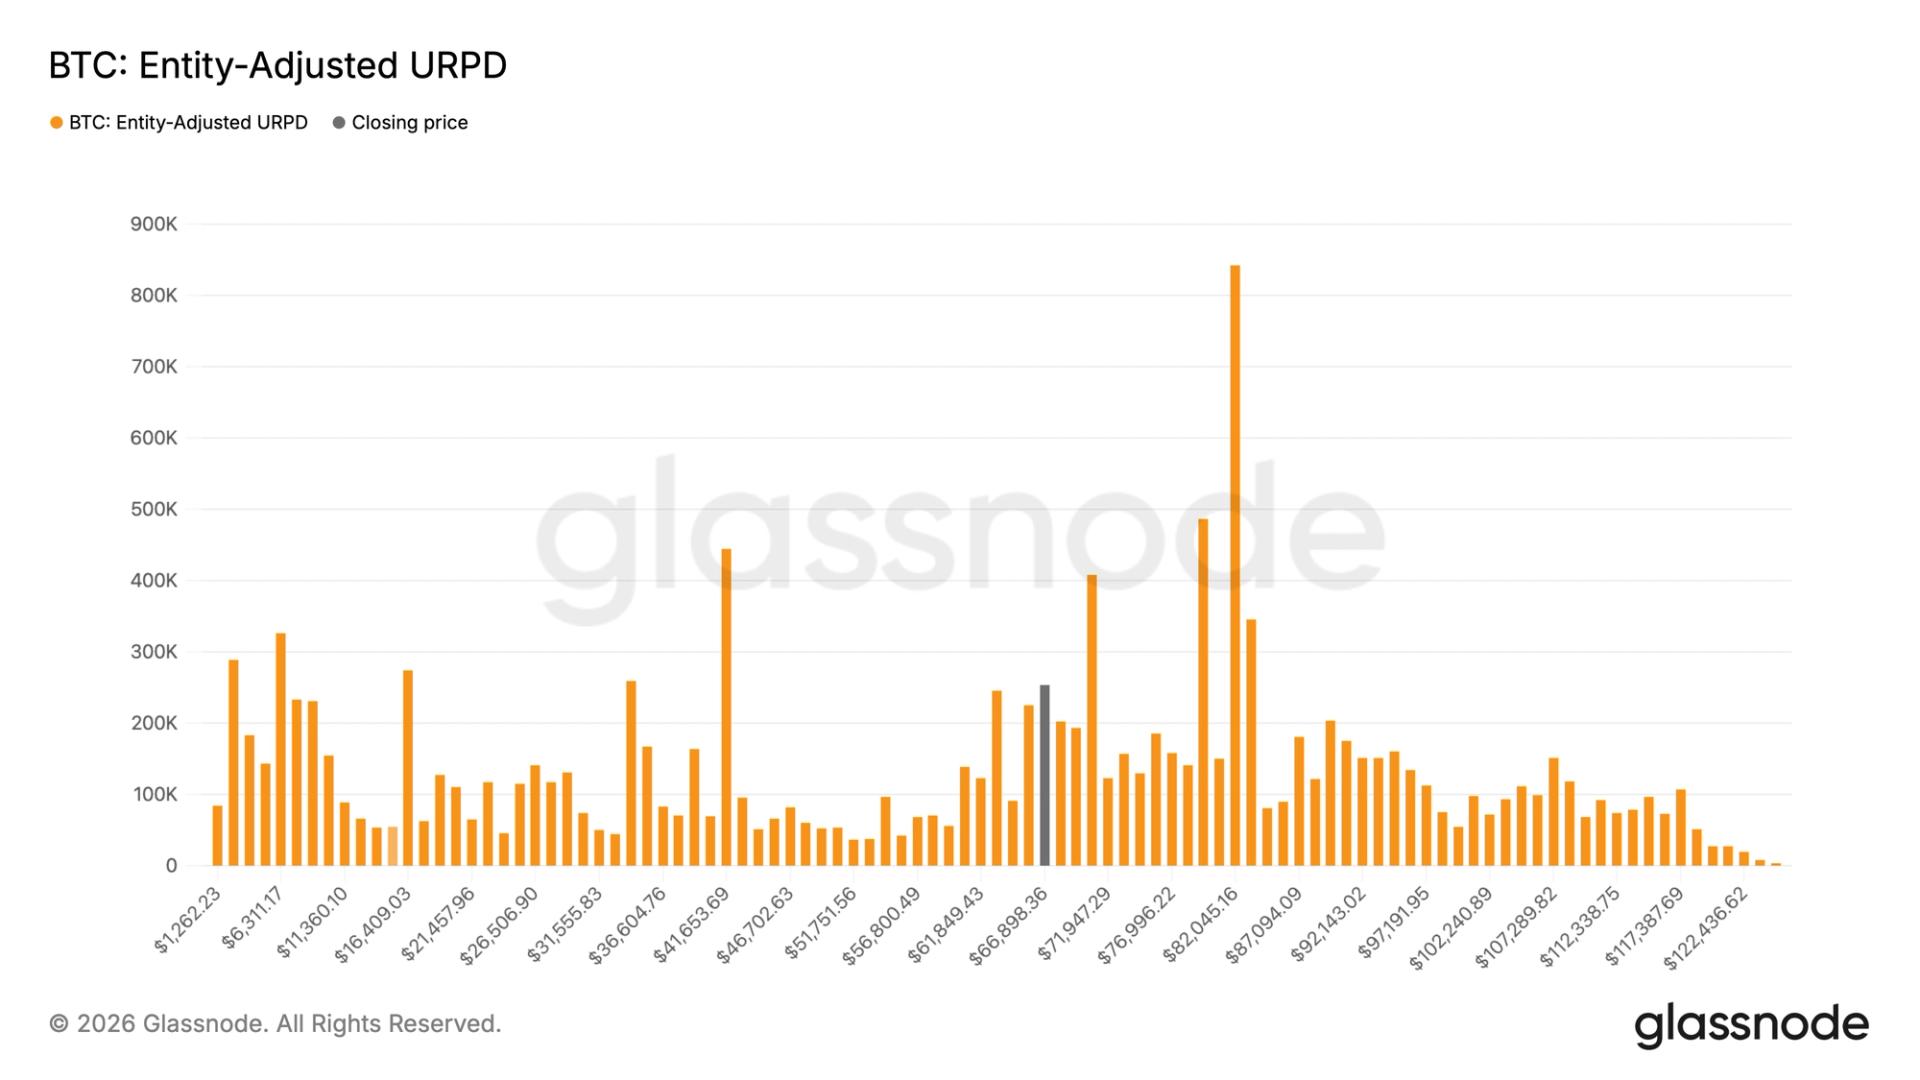
Bitcoin buyers add over 250,000 BTC between $59,000 and $67,000 as accumulation returnsCoinDesk

SpaceX Reveals New $60 Billion Aspiration Days After IPOBeInCrypto

Bitcoin OG Moves 2,373 BTC After 7 Years of SilenceU.Today
Bitcoin rallies after Japan rate increase with XLM, INJ, UNI advancingCoinDesk

Ethereum (ETH) Adds 107% in 24 Hours: Volume Back at Bullish LevelU.Today